FACTS Dose Escalation CRM
CRM / N-CRM / BLRM (Bayesian Logistic Regression Model)
1 Introduction
1.1 Purpose of this document
This document describes how use the FACTS Dose Escalation (DE) N-CRM design engine. It is intended for all end users of the system.
1.2 Scope of this document
This document covers the FACTS Dose Escalation N-CRM design engine user interface.
This document does not address the internal workings of the design engines or algorithms, which are addressed in the associated Design Engine Specification. It also does not address the use of FACTS Core Designs or Enrichment Designs, which are covered in other User Guides.
The screenshots provided are specific to a particular installation and may not reflect the exact layout of the information seen by any particular user. They were taken from FACTS 6.3.0 and later installed on Windows 10. Different versions of Windows or the use of different Windows themes will introduce some differences in appearance. The contents of each tab, however, will be consistent with the software.
1.3 Context of this Issue
This document has been updated for the version 7.0.0 release of Dose Escalation FACTS.
1.4 Citing FACTS
If writing in LaTex and using Bibtex, if you wish to cite FACTS (thank you!), can we suggest the following:
@techreport{FACTS71,
  author = {{FACTS Development Team}},
  title = {{FACTS}: Fixed and Adaptive Clinical Trial Simulator},
  year  = {2024},
  month = {11},
  number = {Version 7.1},
  type         = {Computer Software},
  institution = {Berry Consultants LLC},
  address = {Austin, TX},
  note   = {https://www.berryconsultants.com/software/facts/}
}
This will result in a reference that, for example in the APA style, will look like the following:
FACTS Development Team (2024). FACTS: Fixed and adaptive clinical trial simulator. Computer Software Version 7.1, Berry Consultants LLC, Austin, TX. https://www.berryconsultants.com/software/facts/.
1.5 Definition of Terms
Table 1 gives an overview of the acronyms and abbreviations used in this document.
| Name | Definition |
|---|---|
| Cap | A limit on the number of subjects recruited. In FACTS N-CRM users can specify a cap on the overall number of subjects to be recruited in the trial (the ‘Overall Cap’) and specify stopping rules to define when the trial should stop before it reaches cap. |
| Control | Is the treatment arm with which the novel treatment(s) are principally being compared. Control may be placebo, or some existing standard of care, or therapy, against which the novel treatment has to be benchmarked in order to determine its likely usefulness. |
| Core | FACTS Core: A mode of FACTS for designing trials where multiple treatments, (possibly different doses of a novel treatment) are tested against a control and optionally an active comparator. |
| CRM | Continual Reassessment Method – a dose escalation design where the dose-toxicity is estimated using a simple Bayesian model, and the resulting estimates used to control the dose escalation and estimate the Maximum Tolerated Dose (MTD). |
| DE | Dose Escalation: a mode of FACTS where subjects are treated in cohorts and dose escalation is determined by the number of toxicities observed. |
| ED | Enrichment Designs: a mode of FACTS for designing trials where the same treatment is testing in different settings for example different sub-populations or different but related indications. |
| FACTS | Fixed and Adaptive Clinical Trial Simulator. |
| Final Endpoint | The final value, or state, of a subject’s endpoint. |
| GUI | Graphical User Interface, the part of the FACTS application that the user interacts with. |
| Method | In the FACTS documentation we try to reserve the term ‘method’ for the algorithms used in the simulation (as opposed to the analysis) part of the program. In the analysis part we use the term ‘Model’, see below. |
| Model | In the FACTS documentation we try to reserve the term ‘model’ for the statistical models used in the analysis of the trial data (in the ‘design’ section of the FACTS user interface). Where mathematical algorithms are used for other purposes in FACTS (for instance in the generation of the simulated data) we try to use the term ‘method’. We have found that initially it is very easy for users to be confused between these two parts of FACTS and we feel that using distinct terminology may help to reduce this. |
| MTD | The dose most likely to be the Maximum Tolerated Dose (MTD) – the dose with the highest Pr(MTD). |
| MTD+ | The dose most likely to be the MTD+ – the dose with the highest Pr(MTD+). |
| Pr(MTD) | A dose’s probability of being MTD is the probability that it is the dose with the highest probability of having a toxicity rate in the acceptable toxicity band, and (if a threshold has been specified) does not have a probability of excess or unacceptable toxicity above the threshold. This estimate of MTD is constrained to select one of the available doses. |
| Pr(MTD+) | A dose’s probability of being the MTD+ is the probability that it is the dose with the highest probability of having a toxicity rate in the acceptable band, and (if a threshold has been specified) does not have a probability of excess or unacceptable toxicity above the threshold. Unlike Pr(MTD), Pr(MTD+) includes estimating whether a dose below or a dose above the range of those being tested is more likely to have a toxicity in the acceptable band than any of the doses in the range. |
| Profile | A profile is a specification of one aspect of a scenario. A scenario is made up of one profile of each of the required types for the type of trial being simulated. FACTS allows the user to specify multiple profiles of each type and then presents all the possible combinations of profiles as scenarios that can be used to drive simulations. |
| Response | The change in a subject’s endpoint compared to their baseline state. |
| Scenario | A scenario is the complete specification of the unknown external factors that determine the data observed on the trial and its timing. The exact factors depend on the type of trial being simulated but typically include: -) the distribution of the final change from base line, or probability of response or rate of events in the different treatment groups -) the properties of subjects’ early responses and the correlation with their final outcome -) the rate at which subjects are recruited into the trial -) the rate at which subjects drop out of the trial. |
| SPEC | The Design Engine Specification, describes the system algorithms, and meaning of parameters. |
| Response | The change in a subject’s endpoint compared to their baseline state. |
| Subject | Someone recruited onto a clinical trial for the purposes of learning about the properties of a treatment. Depending on the type of trial they might be patients or they might be healthy volunteers. |
| Treatment Arm | Subjects on entering the study are randomized to different ‘treatment arms’. Subjects randomized to the same arm receive the same treatment and the responses of the subjects in the arm analyzed to determine the expected response to that treatment, allowing the expected responses to the different treatments to be compared. |
| UG | The User Guide; describes how to use the system. |
1.6 References
[N-CRM] = (Neuenschwander, Branson, and Gsponer 2008)
[Backfill] = (Dehbi, O’Quigley, and Iasonos 2021)
[Open Enrollment] = (Broglio et al. 2015)
[CRM 2 Sample] = (O’Quigley, Shen, and Gamst 1999)
[bCRM] = (Braun 2002)
[CRM Ordinal] = (deMoor et al. 1996)
2 FACTS Overview
This user guide assumes some limited general familiarity with FACTS and concentrates on describing the interface for designs using the N-CRM approach. See the FACTS Dose Escalation user guide for a general introduction to the FACTS Dose Escalation user interface.
The N-CRM is based on the method described in the paper (Neuenschwander, Branson, and Gsponer 2008). It is designed for use in oncology phase 1 trials, and we understand generally in use at Novartis for the majority of their trials of this type:
- Dosing starts at a (very) low dose, strongly believed to be safe.
- Usually after a cohort of subjects have completed their current dose, the dose to be used for the next cohort is selected. The selection of this dose is dictated by a combination of dose escalation rules, the estimate of the toxicity rate on the different doses and the target maximum tolerated toxicity, or toxicity band.
- The endpoint per subject is binary: toxicity observed or not.
- There is either a predefined set of doses to explore, or a dose range.
- There is limited sample size.
2.1 FACTS 7.0.0 Changes to N-CRM
In FACTS 7.0.0 the only change was on the Analysis tab, when entering subject data manually, the FACTS GUI now ensures that a cohort number is entered for every subject.
2.2 FACTS 6.5 Changes to N-CRM
In FACTS 6.5.0 there was a new feature added to N-CRM:
- It is now possible to generate a design report – a Word document describing design - once the design has been simulated. In FACTS 6.5.0 there was two small changes to the functionality:
- When deriving toxicity/efficacy priors from quantiles at the lowest and highest doses, the “middle” probability option now refers to the median dose rather than the reference dose and is now optional. When pre-6.5.0 FACTS files are loaded in FACTS 6.5.0, the “middle” probability option will be ignored and replaced by 0.5.
- When deriving toxicity/efficacy priors from specific quantiles the specification of at least two dose levels is now required whereas previously the specification of at least three dose levels was required.
In FACTS 6.5.0 there were some improvements in the simulated behavior:
- Designs which include efficacy, the “Maximum cohorts used to determine MTD” parameter on the Allocation Rule tab is now observed, in FACTS 6.4.0 and earlier it was ignored.
- In N-CRM designs using open enrollment without accrual pausing, FACTS will now output entries in the cohort file for subjects that have been lost following stopping rules being met.
- In N-CRM designs using open enrollment, FACTS will no longer prematurely apply stopping conditions when there are still subjects whose outcomes have been observed, but not yet processed.
- In N-CRM designs using open enrollment, FACTS will now report the selected MTD/MED/OSD and associated state to be the dose where the stopping conditions were first met, unless the MTD has subsequently decreased post stopping rules being met. This is to prevent a dose above the one selected when the stopping conditions were met being reported as the MTD when it is very likely that there is insufficient data on this higher dose to justify its selection. If rather than reporting the MTD at the point when the stopping rules where met, you would like the trial to resume if the dose selected as MTD has changed (and this the stopping rules possibly no longer met), ensure that the ”Pause accrual and wait for completers” option is selected on the “Stopping Criteria” tab. This allows the trial to resume if the recruitment cap has not been met.
- FACTS Command Line mode and FLFLL (FACTS Linux File Loader Lite) now correctly handle the processing of N-CRM designs whose prior was derived using the “Legacy Prior” option.
2.3 FACTS 6.4.0 Changes to N-CRM
In FACTS 6.4.0 there were no changes to the Dose Escalation simulators.
2.4 FACTS 6.3.0 Changes to N-CRM
In FACTS 6.3.0 a number of changes were made to improve facilities in N-CRM, or improve the way existing facilities were implemented. These were:
- New run-in options: the existing run-in scheme is available as “simple run-in”, “custom run-in” allows a specific sequence of doses and number of subjects to test at each dose to be specified, “small cohort pre-escalation” allows a run that uses a smaller cohort size but follows the dose escalation rules and over dose control.
- New “backfill” options in open enrolment. Backfill allows subjects that become available at a time when they can’t be allocated to the current dose (because the maximum number of subjects without final results have already been allocated to the current dose).
- Improved handling of “maximum subjects without final results” in open enrolment. In earlier versions of FACTS this was a “global” maximum, which led to a suboptimal allocation pattern and overly cautious rejection of subjects that became available. The new model applies a maximum “per dose” so that once the trial has escalated to a new dose strength, any subjects without final results on lower doses do not block allocation to the new dose, in addition it is possible to specify two different maximums – one for when a dose has just been escalated to but has not been “cleared” (typically smaller and more cautious), and one when a dose has been cleared but we continue to allocate to it because it is the target dose (typically larger and more confident). This method is such an improvement that we recommend moving any design using open enrolment to this new version of FACTS.
- Improved Ordinal Toxicity model – the way the likelihood is calculated has been improved – reducing the uncertainty in the model fit. Any design using an ordinal model will need to re-calibrate the prior if you move the design to FACTS 6.3.0. If you have a design already complete, or in execution we recommend you remain using the earlier version of FACTS for that trial.
2.5 FACTS 6.2.0 Changes to N-CRM
In FACTS 6.2.0 features available separately in the other FACTS CRM engines (CRM (Toxicity), bCRM & CRM Ordinal) were all incorporated into N-CRM. This allowed these features to be used in conjunction with N-CRM’s target toxicity band methodology, overdose control and open enrollment features, as well as in conjunction with each other for the first time.
The new features are:
- From CRM (Toxicity) the option to specify that the data is coming from ‘two groups’ and for the toxicity experienced in the two groups to be modelled with a joint model [CRM 2 Sample]. This allows a trial where there are two patient populations (such as adults and children) or where there are two versions of the treatment to be simulated.
- From bCRM the option to model a second binary efficacy endpoint [bCRM] and the for dose allocation to proceed in two stages – the first to establish an MTD and the second to establish an MED.
- From CRM Ordinal the option for the toxicity endpoint to be modelled not as binary endpoint, but one with different categories of toxicity, and with a joint model applied to the different categories [CRM Ordinal]. The endpoint can be to model either 3 or 4 categories of toxicity:
- category 1 is “no toxicity”,
- category 2 is “mild toxicity”,
- category 3 is “toxicity”
- category 4 (if included) is “severe toxicity”
All decision making is made in terms of the probability of observing a category 3 (or worse) toxicity.
2.6 FACTS 6.1.0 Changes to N-CRM
In FACTS 6.1.0 N-CRM has the new feature of ‘design variants’ that allow the user to easily simulate and evaluate an N-CRM design at different sample sizes. This change includes 4 elements:
- Under the ‘Study’ tab the user can now specify the number of design variants, and for each variant the maximum study size in Cohorts.
- On the simulation tab FACTS will display a copy of each simulation scenario for each variant.
- The simulation results now include the Ppn of trials that stopped for each stopping reason: stopping because all doses are too toxic (the toxicity estimates exceed the overdose criteria), because a stopping rule was met or because the study cap was reached.
- There are now a set of cross variant graphs that show trellis plots of the key summary graphs by design variant and scenario.
3 Starting FACTS
FACTS is usually first started using the FACTS icon installed on the Windows desktop or from the Windows Start \> Programs menu.
When the application opens, you are presented with the main introduction screen of FACTS (Figure 1). From here you can start designing an N-CRM trial, by double clicking N-CRM in the list of available designs, or by selecting the N-CRM design option from the File \> New \> Dose Escalation menu.
FACTS will also be associated the parameter files it writes out with a ‘.facts’ file extension. Clicking on any one of these files will automatically start FACTS with that file opened.
Note: Depending on your license, some design options may not be available.
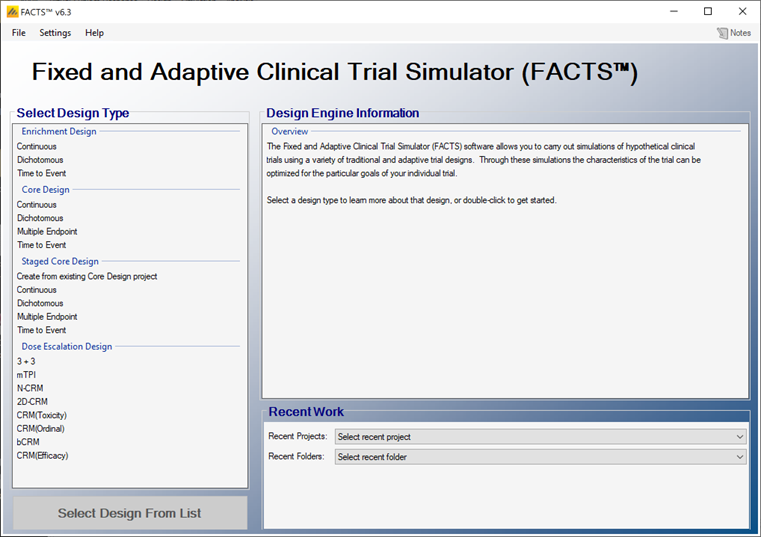
From this screen a new design can be started by selecting the design type in the list and double clicking it, or clicking on the ‘create new’ button at the bottom of the list.
In the ‘Recent Work’ panel, the use can select from the list of most recently opened FACTS files, or from the list of directories where those files were located, opening the folder and selecting a FACTS file from there.
Once a FACTS design has been created, the appropriate FACTS design module can be launched by double clicking on the “.facts” file in Windows Explorer.
Once a specific type of FACTS design has been selected or an existing FACTS file opened, the FACTS GUI displays the tabs and parameters appropriate to that type of trial design.
4 The FACTS N-CRM GUI
The FACTS N-CRM GUI conforms to the standard FACTS GUI layout, with information and displays divided across various standard tabs (Figure 2).
- The Study Tab has sub-tabs for entering Study Information and specifying the Treatment Arms (doses) available in the study. This is where the user specifies the ‘given’ requirements, or constraints, of the trial to be designed.
- The Virtual Subject Response tab has sub-tabs for specifying Explicitly Defined response scenarios to simulate and loading External data files of simulated subject responses. This is where a set of different toxicity rates per dose are specified that should represent the expected ‘space’ of the expected dose-toxicity profiles for the compound being tested.
- The Design has sub-tabs for specifying the Allocation Rules, Stopping rule and Toxicity Response model. These are the design choices open to the trial biostatistician. The expected consequences of these design choices are estimated by running simulations of the trials using the various virtual subject response profiles defined.
- On the Simulation Tab, the user controls and runs simulations and can view the simulation results.
- On the Analysis tab, the user can use the design to analyze a specific data set and report the result of fitting the specified toxicity response model and the recommended dose for the next cohort.

Also on the menu bar, on the right hand side of the FACTS Window, is a button labeled “Notes”; clicking this button reveals a simple “notepad” window in which the user can maintain some simple notes that will be stored within the “.facts” file (see Figure 3 and Figure 4)
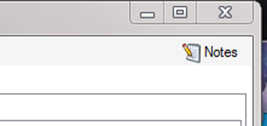
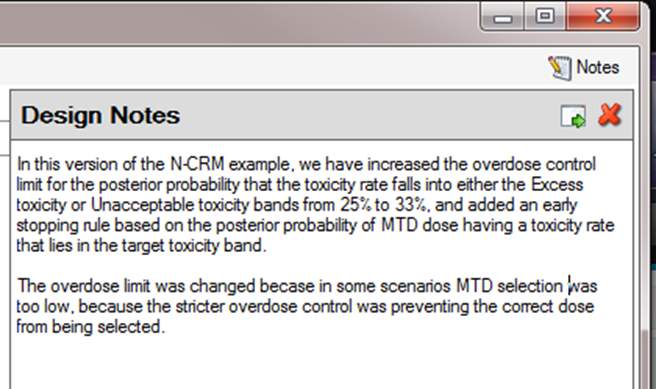
The notepad window comes with two further buttons: one to change the window to a free floating one that can be moved away from the FACTCS window; and the other to close it.
The Notes field can be used for any text the user wishes to store with the file. Suggested uses are: to record the changes made in a particular version of a design and why; and to comment on the simulation results. This will help when coming back to work that has been set aside, to recall what gave rise to the different version of a design.
